

 pm01@hvhipottester.com pm02@hvhipottester.com
  8618986157274
  +86 18986157274
  live:1379417129
 1379417129
 Tech: CT Volt-Ampere Characteristic Test And 10% Error Curve Verification
1 Concept of CT volt-ampere characteristics
CT volt-ampere characteristics refer to the relationship curve between the excitation current on the secondary side of the current transformer and the voltage applied on the secondary side of the current transformer when the primary side of the current transformer is open circuit (voltage is the ordinate, current is the abscissa) ), which is actually the magnetization curve of the iron core.
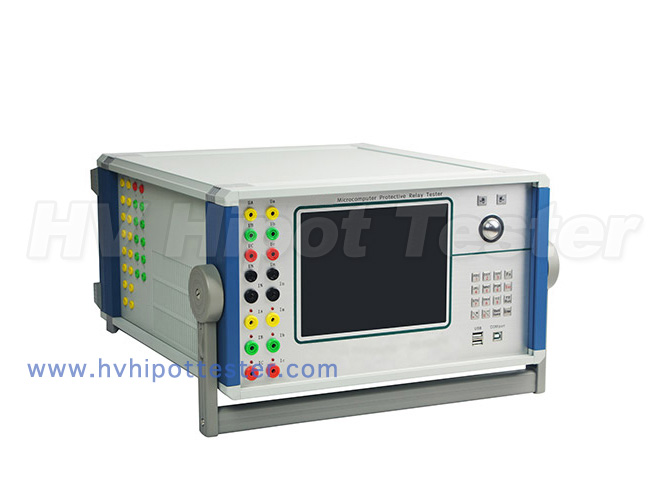
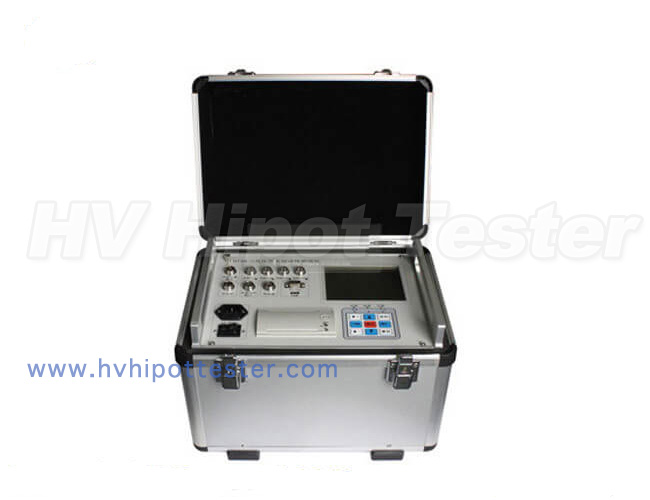
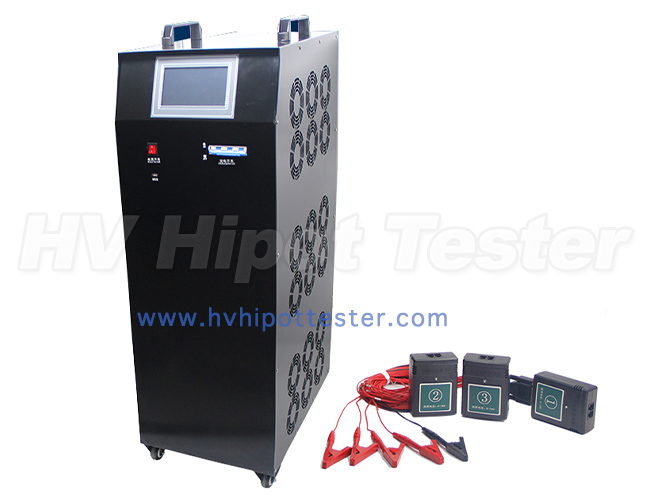
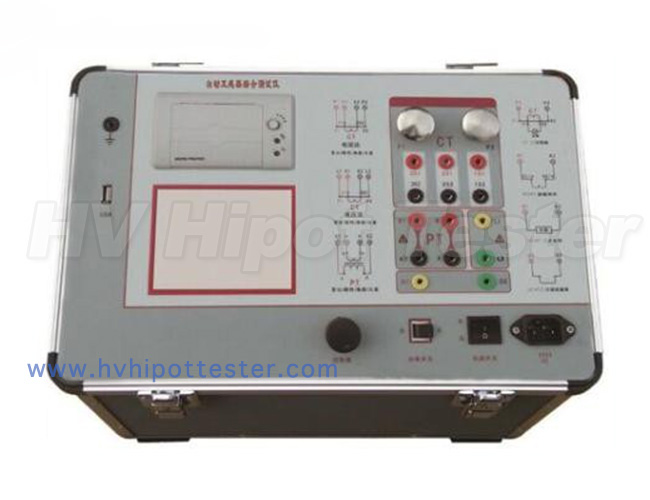 |  | 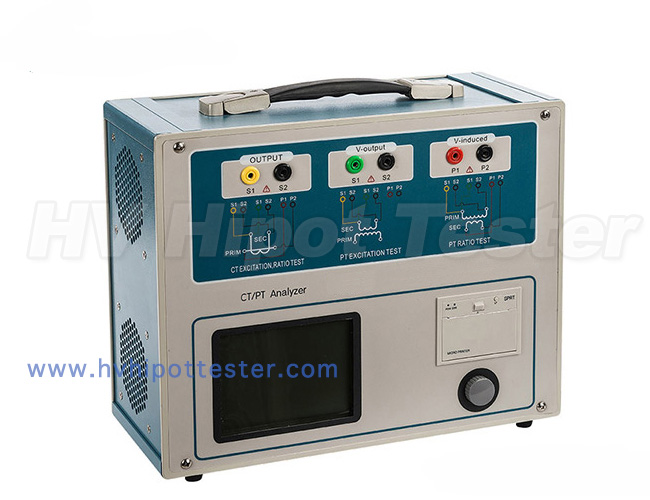 |
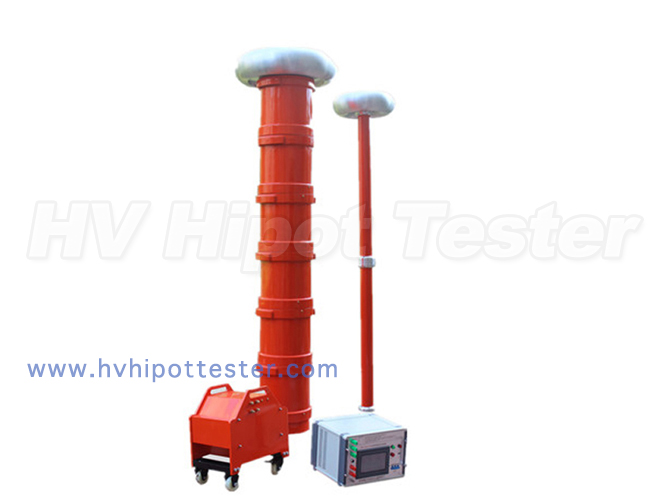
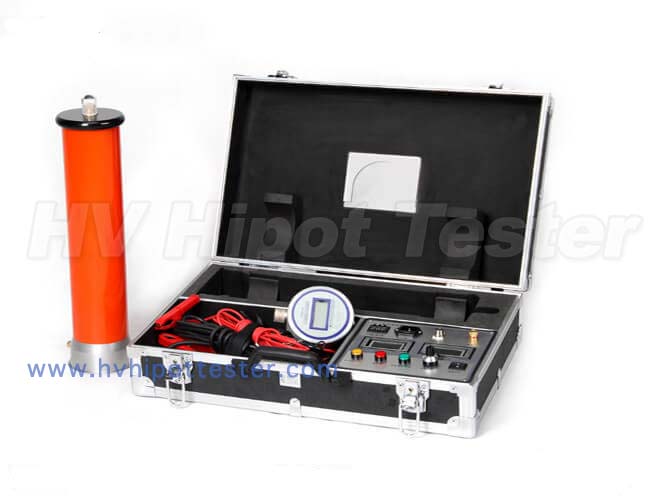
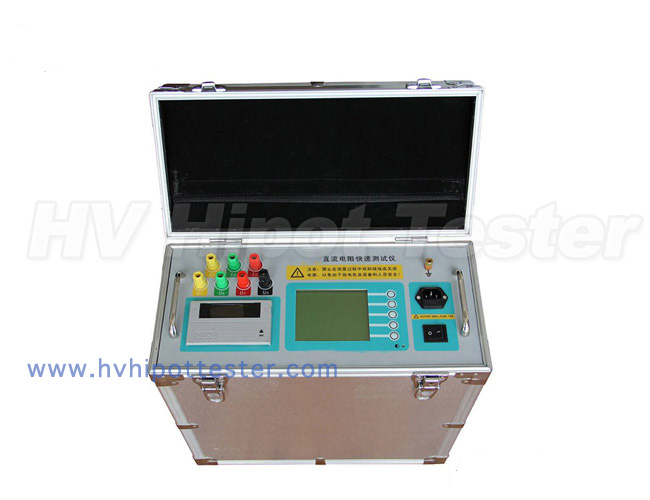
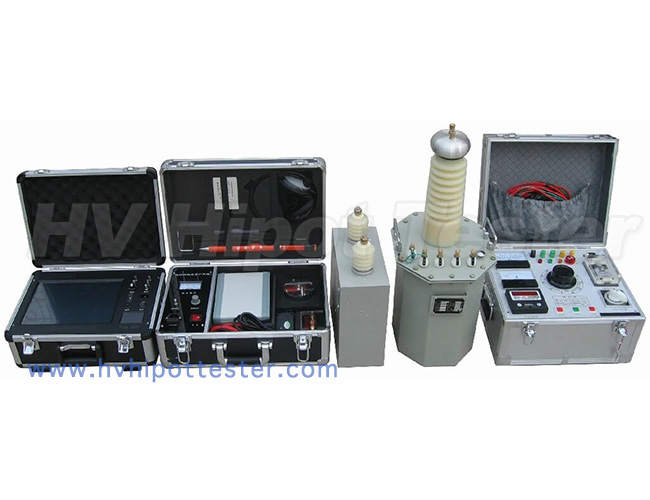
| HVHG-F CTPT Comprehensive Transformer Tester | HVFA-D CT PT Tester | HVCT-1000P CT/PT Analyzer |
2 Purpose of CT volt-ampere characteristic test
(1) Check the core quality of newly put into production transformers and leave the original experimental data of CT.
(2) During outage inspection and maintenance of CT, by identifying the saturation degree of CT volt-ampere characteristics, that is, the position of the voltage inflection point, it is possible to determine whether there are defects such as inter-turn short circuits in the windings of the transformer after a certain period of operation, so as to promptly discover equipment defects and ensure equipment safety run.
(3) Make a CT10% error curve based on the CT volt-ampere characteristics to verify the CT accuracy.
More information:
Project, News, Video,please kindly click the letters to view:
Product: Category: CT PT Analyzer
Video: Relay Tester, CT PT Tester, Secondary Circuit Tester
News: Relay Tester, CT PT Tester, Secondary Circuit Tester
Project:Relay Tester, CT PT Tester, Secondary Circuit Tester
3 CT volt-ampere characteristic test
When comparing the measured volt-ampere characteristic curve with the factory volt-ampere characteristic curve or the latest measured volt-ampere characteristic curve, the voltage at the inflection point position should not be significantly reduced. If there is a significant decrease, check whether there is an inter-turn short circuit in the secondary winding. If the voltage at the rated frequency applied to the secondary terminal of the current transformer increases by 10%, the excitation current will increase by 50%, and the root mean square value of this voltage is called the inflection point position voltage.
Its theoretical basis: the CT core at the inflection point enters a saturated state. At this time, almost all the excitation current is lost in the heat of the core. Since the CT DC resistance R2 is related to the number of CT secondary winding turns, when the CT secondary winding turns are short-circuited , causing the DC resistance R to decrease, which is manifested in the CT volt-ampere characteristics as a significant decrease in the voltage U at the inflection point (when the saturation current of the CT core remains unchanged, the voltage at the inflection point U0'=I saturation × R2), according to This determines that the CT secondary winding is abnormal.
Case analysis: Figure 1 shows the one-volt-ampere characteristic curve, in which the horizontal axis is the current I, the vertical axis is U, points A and B are the inflection points, the voltage at point B is 1600 V, the voltage at point A is 1878 V, and the voltage at point B is 1878 V. The voltage is significantly lower than the voltage at point A. Both curves are the same CT volt-ampere characteristic curve, and the upper 1 curve is the original volt-ampere characteristic curve when the CT leaves the factory, and the lower 2 curves are the latest measurement curves. According to the above analysis, it can be seen that the CT A defect exists and requires further inspection or replacement.

Figure 1 volt-ampere characteristic curve
4 CT 10% error curve verification
The 10% error curve is an important basic characteristic of the current transformer for protection. The relay protection device reflects the fault condition of the primary system. When the primary system fails and the protection device is activated, the primary current of the current transformer is usually much larger than the current during normal operation. Therefore, the error of the current transformer will also increase. In order for the electrical protection device to correctly reflect the primary system condition and operate correctly, the current transformer ratio error is required to be less than or equal to 10%. Whether the primary current increases or the secondary load impedance increases, the result will cause the induced electromotive force of the current transformer to increase, thereby increasing the error. The so-called 10% error curve is the characteristic curve of the relationship between the ratio of the primary current (I1) to its rated current (I1N) (m = I1/ I1N) and the secondary load impedance (ZY) when the ratio error is 10%. It can also be understood as the maximum secondary load impedance allowed to make the current transformer ratio error less than or equal to 10% under different primary current multiples.
In actual work, the volt-ampere characteristic method is often used to first measure the volt-ampere characteristic curve of the CT, and then draw the "10% error curve of the CT" based on the volt-ampere characteristic curve of the CT. According to the 10% error curve of the current transformer, the maximum allowable impedance ZYmax of the secondary circuit is obtained and compared with the actual impedance ZL of the secondary circuit. If ZL<ZYmax, it is considered that the current transformer meets the 10% error requirement.

Figure 2 Equivalent circuit diagram of current transformer connected to load
Theoretical basis:
The following relationship is obtained from Figure 2
E=I2×(Z2+ZY) (2)
m=I1/IN (3)
When the transformer error is 10%, the following relationship exists:
I2=9I0 (4)
I1/k=10I0 (5)
Substituting formula (4) into formula (2) yields:
ZY =E/9I0-Z2 (6)
Substituting formula (5) into formula yields:
m= I1/I1N=10I0 /5=2I0 (7)
According to the excitation characteristic E-I0 data calculated in 2) and formulas (6) and (7), the 10% error curve of the current transformer can be obtained.
Case analysis: Table 1 is the measured and calculated data of LB-220 current transformer, and its ultimate purpose is to calculate the secondary allowable load ZYmax. Figure 3 is a function curve of ZYmax and m, with a 10% error, drawn based on the data in the table. Different maximum allowable load impedances can be found for different short-circuit current multiples. Assuming that the current transformer is used at the maximum short-circuit current Ik=18kA, then m=15, and ZYmax=3.9Ω is found, which is greater than the measured secondary load of 1.96Ω. The conclusion is that it can meet the requirements.

Figure 3 10% error curve
Table 1 Measurement and calculation of CT 10% error curve
| Basic parameters | Primary rated current | 1200A | Secondary rated current | 5A | Accuracy level | 10P20 |
| Secondary load | Current I | 5A | Measured voltage | 9.8V | ZL | 1.96Ω |
| Test items | Symbols | Data source | Values | ||||||
| Excitation current | I0 (A) | Measured by experiment | 0.5 | 1 | 2 | 4 | 5 | 6 | 8 |
| Test voltage | U0 (V) | Measured by experiment | 280 | 290 | 298 | 300 | 306 | 308 | 310 |
| Winding internal resistance | R2(Ω) | Measured by experiment | 0.535 |
| Winding leakage reactance | Z2(Ω) | ≈2R2 | 0.706 |
| Internal electromotive force | E0(V) | =U0-I0Z2 | 279 | 289 | 296 | 297 | 302 | 304 | 304 |
| Allowable total load | Z2+ZY | =E0/9I0 | 62.1 | 32.1 | 16.5 | 8.25 | 6.72 | 5.63 | 4.22 |
| Allowable secondary load | ZY(Ω) | = E0/9I0-Z2 | 61.4 | 31.4 | 15.9 | 7.55 | 6.02 | 4.92 | 3.52 |
| Short circuit current multiple | m | 2I0 | 1 | 2 | 4 | 8 | 10 | 12 | 16 |


pm01@hvhipottester.com
+86 18986157274
+8618986157274
1379417129